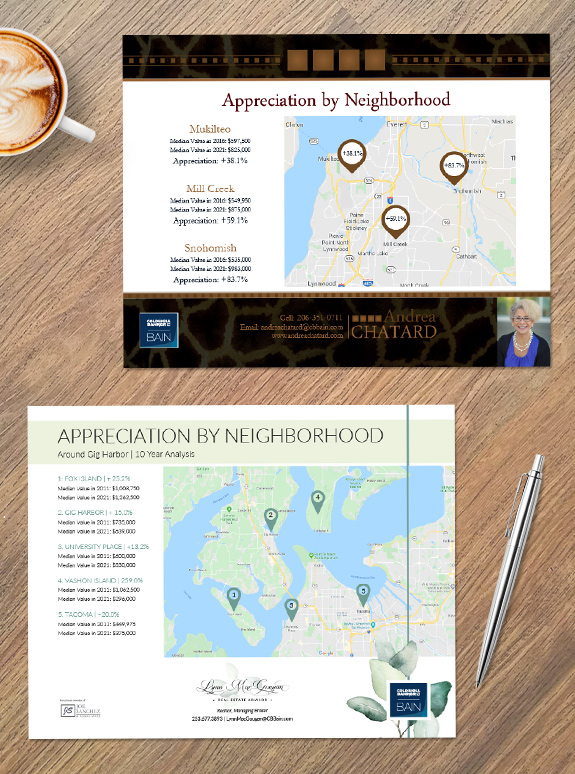
Are you helping a seller visualize the market value of their home? Or are you assisting a buyer in pin-pointing a good area for investment? Or maybe you are at an open house and want something valuable to give to potential buyers? The Appreciation by Neighborhood map can be a star in all of those situations!
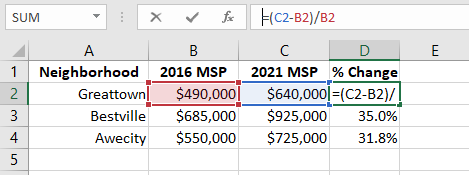
It’s a great way to visually show how neighborhoods, cities, or other map-able areas compare to each other. The tool itself is a simple visual comparison of neighborhoods around the area. To calculate overall appreciation, just dig into your MLS and pull the median sales price now and 3, 5, or 10 years ago. Then calculate the appreciation. (I do this in Excel to make the math easier.) The formula for the appreciation looks like this:

In Excel, the formula looks like this:

Make it stand out with your personal branding, colors, and fonts. That way, no matter where it goes, your Appreciation by Neighborhood map will stand out and boost your recognition for current and future clients.
Want to add the Appreciation by Neighborhood to your market stats toolbox? Call us at (360) 527-8904 or email solutions@thelonesgroup.com.
 Curious about how your personal style can be represented in a professional brand? Book a branding consultation today!


 Posted in
  Tags:
Tags: 
