When I was a new agent – and I mean a brand new agent in my very early 20s – I was called to go out on a listing presentation. I had not met the seller before nor been on his property. I got to the house and briefcase in hand, began walking up to the front door when my potential seller opened the door, looked me up and down, and asked, “Where is Denise?”
Since I had heard the “You’re so young!” statement a number of times already, I knew what was going through his mind. I smiled and replied, “I am Denise.”
He chuckled. “Denise… Have you ever sold a house? … Have you ever bought a house? … I bet you still live with your parents!”
Unfortunately, he was absolutely correct. I did still live with my parents. But I was determined to salvage this presentation. I opened my mouth to speak when –
“Come back when you know what it is like to be a homeowner selling a house!” and he slammed the door in my face.
I stood there for a moment, stunned. I had no idea what to say. I had not yet learned the skill of articulating my value, so I was truly at a loss for words. I turned and walked back to the car. I drove a few blocks, then pulled over and began to cry. I sobbed. It was not pretty.
But in that moment, something changed in me. I decided I was never going to let anyone make me feel that bad again. And while I needed to save some more money before I could buy a place of my own, I decided to get serious about my business and up my game.
In order to compete with older, more experienced agents in my market, I needed to do something that was different than what everyone else was doing. And I decided to start with price.
I made an effort to seek out the one agent in my office who always seemed to be spot on when it came to pricing properties. His listings sold – quickly – and his sellers were thrilled with the results. One day, I popped my head into his office and asked if I could talk to him about his pricing methods and if he would share his secrets.
He scoffed, “It’s not a secret formula. I base my pricing on whether the receptionist has time for a smoke break with me on Monday mornings.”
I was completely confused and asked him what he meant.
He went on, “Sometimes she has too many new contracts to enter and doesn’t have time for a smoke break. When that happens, I know it is a hot market. And I price accordingly.”
And with a sip of his coffee, he was out of his desk and down the hall, off to close more deals.
I thought about what he said and the principle was very simple. He was talking about the basic principle of supply and demand. However, as agents, our way to measure supply and demand is usually by a Comparative Market Analysis (CMA). The challenge of using a CMA is that it measures listings that have closed. And those properties may have closed a month ago or six months ago. But the point at which the property ceased to be “available inventory” is when it went pending. And that is the crucial moment when looking at the relationship between supply and demand.
Armed with this revelation, I began tracking pending sales every week – tabulating the number of pendings versus the number of listings. By tracking this relationship, I found this gave me a much more accurate measure of the heat of the market. I not only began using this tool in my business, but I also became very well-known for it, because IT WORKED! And what was better? The focus came off my age and instead focused on my unique ability to price property accurately and my unique pricing system tools.
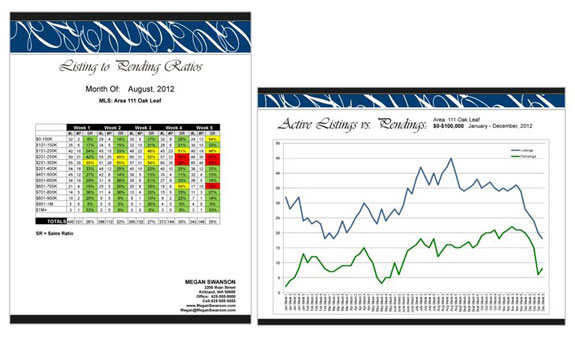
The Pricing System I developed included a number of research tools, but the heart of the system focuses on the inventory and how much inventory is demanded each week – Listing versus Pending Ratios.
I tell you this story to illustrate the power of research. And research can also help your sellers see your point of view on price.
Did this research take time? You bet. Every week I would spend about 45 minutes tracking the pendings and listings over a variety of areas and price points. But once you have the system set up, it is actually very easy to go in and do the research, as it becomes just a matter of pulling the reports and filling out your form.
How do Listing versus Pending Ratios work?
Let’s say there are 100 homes on the market. In one week, 25 listings pended. This represents a 25% listing to pending ratio:
- A buyer’s market is categorized as having a ratio between 0-45%
- A balanced market is 45-55%,
- A seller’s market is anything above 55%
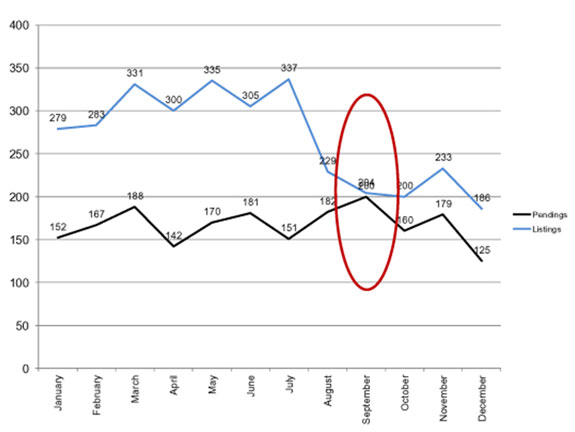
It is important to know not only where the market is right now, but also how the market has been trending over the course of the past few weeks. Take a look at the chart below …
The top line represents the inventory trend while the bottom line reflects the pending trend. In September, the number of listings was 455 while the number of pendings was 100. This shows a 21.98% ratio, which indicates a buyer’s market.
As an agent, when I start to see those lines get further apart, I can go to my sellers and indicate that it may be time for a price reduction –especially if there is little activity on the property. An agent working with a buyer may also use this information to be better-educated when it comes to making an offer.
In the second graph below, the inventory has dropped significantly (to 200) while the pendings have increased to 206 in September. This represents a 97% listing to pending ratio which means there is very, very little inventory – a fact which is important for both buyers and sellers to be aware of.
What do I do with this information?
I also developed a set of props which I used to explain the supply and demand principles as they pertained to real estate. These tools allowed me to talk about the price of the seller’s home not in terms of how much their house is worth, but instead in terms of where the market is.
Think about the power of this. Imagine having the pricing discussion with your seller at a listing presentation. The pricing discussion may go as follows:
Agent: After looking at the CMA, I am seeing a range of $340,000-$360,000 for your property
Seller: But the houses in the CMA are my neighbors’ and I know they don’t have upgraded windows and hardwood floors throughout the house like mine! We should price it at least at $400,000.
Agent: The other homes have other upgrades that yours didn’t. For example, here we have…
Sound familiar? The challenge with this type of conversation is that it becomes about the seller’s property. And once you start down this road, sellers get defensive and the relationship becomes adversarial.
But what if you could tweak the conversation so the focus isn’t on the particular property, but on the market? Let’s take a look at that conversation again and this time, the agent has a number of props to:
First, explain how the market works:
Then show where the market is now:
And then have a discussion about “the market”. The conversation could look like this:
Agent: The market is indicating we should be between $340,000-$360,000
Seller: But my neighbor’s house sold for $400,000!
Agent: The market was different when your neighbor sold. The real estate market, like the stock market, fluctuates all the time. And now the market is indicating $340,000-$360,000.
Then the seller needs to choose whether they can be in the current market or not.
Changing my language about pricing and incorporating my unique pricing research system into my business transformed me as an agent.
What do you do for pricing that is beyond the typical CMA? If the answer is “nothing” then you are missing an opportunity to shine when it comes to having more systems than the agent you might be competing against. Not only that, but I find that agents who don’t have a pricing system in their business struggle when it comes to handling overpriced listings and sellers who want to “try out” a price that is well above the market.
If you need pricing tools in your business, take a moment to look at my Pricing System. We are releasing version 2.0 next week and it is chock-full of the pricing tools you need in your business to stand out. You do still need to do the research yourself, but all the working forms and graphs are there waiting for your personal touch.
Don’t go into another listing presentation struggling to talk about price with unrealistic sellers! Make a commitment to add research and pricing tools to your listing presentation today.


 Posted in
  Tags:
Tags: 

Denise,
Can someone show me how to make the graphs shown here? I do this stuff, but those graphs speak loudly. I agree that pendings speak the loudest and I use those in my cma. We have a gazillion areas to track here but if I just want to do one, which is what is appropriate for a given client, how do I make it look that way? I am mac, not pc, so Publisher isn’t available, but am good with excell and I know I can create graphs from that. I don’t need the fancy sheets, I can put them on my pages easily.
I would be happy to come up there for a tutorial.
Thanks,
Maggie
Maggie- We have two ways we can help you with this. Club Zebra PRO members have access to a webinar on creating graphs with the listing and pending ratios sheets (login to see the tutorial) or, you can schedule some time with Shauna to work specifically on what you want to do. We will touch base with you to make sure you have the help you need. -Denise